


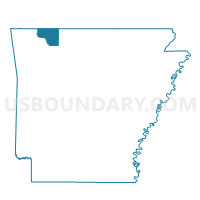
Census Tract 9502, Carroll County, Arkansas
About
Outline

Summary
| Unique Area Identifier | 434577 |
| Name | Census Tract 9502 |
| County | Carroll County |
| State | Arkansas |
| Area (square miles) | 153.88 |
| Land Area (square miles) | 146.45 |
| Water Area (square miles) | 7.43 |
| % of Land Area | 95.17 |
| % of Water Area | 4.83 |
| Latitude of the Internal Point | 36.45049830 |
| Longtitude of the Internal Point | -93.81208790 |
| Total Population | 5,994 |
| Total Housing Units | 3,876 |
| Total Households | 2,955 |
| Median Age | 57 |
Maps

Graphs
Select a template below for downloading or customizing gragh for Census Tract 9502, Carroll County, Arkansas


Neighbors
Neighoring Census Tract (by Name) Neighboring Census Tract on the Map
- Census Tract 201.01, Benton County, AR
- Census Tract 214.05, Benton County, AR
- Census Tract 214.09, Benton County, AR
- Census Tract 904, Stone County, MO
- Census Tract 9501, Carroll County, AR
- Census Tract 9503, Carroll County, AR
- Census Tract 9504, Carroll County, AR
- Census Tract 9505, Carroll County, AR
- Census Tract 9601, Madison County, AR
- Census Tract 9604.01, Barry County, MO
- Census Tract 9606, Barry County, MO
Top 10 Neighboring County Subdivision (by Population) Neighboring County Subdivision on the Map
- Township 2, Benton County, AR (14,279)
- Township 1, Benton County, AR (13,223)
- Prairie township, Carroll County, AR (7,555)
- Cedar township, Carroll County, AR (3,575)
- White River township, Barry County, MO (2,498)
- Sugar Creek township, Barry County, MO (1,851)
- Beaver township, Carroll County, AR (1,787)
- Roaring River township, Barry County, MO (1,333)
- California township, Madison County, AR (1,303)
- Franklin township, Carroll County, AR (1,269)
Top 10 Neighboring Place (by Population) Neighboring Place on the Map
- Holiday Island CDP, AR (2,373)
- Eureka Springs city, AR (2,073)
- Golden CDP, MO (280)
- Beaver town, AR (100)
Top 10 Neighboring Unified School District (by Population) Neighboring Unified School District on the Map
- Rogers Public Schools, AR (81,256)
- Huntsville School District, AR (14,572)
- Cassville R-IV School District, MO (11,765)
- Berryville Public Schools, AR (10,893)
- Eureka Springs School District, AR (7,998)
- Blue Eye School District, MO (5,399)
- Southwest R-V School District, MO (4,746)
Top 10 Neighboring State Legislative District Lower Chamber (by Population) Neighboring State Legislative District Lower Chamber on the Map
- State House District 62, MO (42,780)
- State House District 68, MO (35,930)
- State House District 95, AR (33,192)
- State House District 91, AR (29,747)
- State House District 90, AR (29,000)
Top 10 Neighboring State Legislative District Upper Chamber (by Population) Neighboring State Legislative District Upper Chamber on the Map
- State Senate District 29, MO (190,914)
- State Senate District 8, AR (105,195)
- State Senate District 2, AR (83,273)
Top 10 Neighboring 111th Congressional District (by Population) Neighboring 111th Congressional District on the Map
Top 10 Neighboring 5-Digit ZIP Code Tabulation Area (by Population) Neighboring 5-Digit ZIP Code Tabulation Area on the Map
- 72756, AR (38,455)
- 72616, AR (10,441)
- 72740, AR (9,543)
- 72732, AR (4,716)
- 72632, AR (4,449)
- 65747, MO (3,746)
- 72631, AR (3,709)
- 65745, MO (2,693)
- 65641, MO (1,250)
- 65658, MO (1,131)
Data
Demographic, Population, Households, and Housing Units
** Data sources from census 2010 **
Show Data on Map
Download Full List as CSV
Download Quick Sheet as CSV
| Subject | This Area | Carroll County | Arkansas | National |
|---|---|---|---|---|
| POPULATION | ||||
| Total Population Map | 5,994 | 27,446 | 2,915,918 | 308,745,538 |
| POPULATION, HISPANIC OR LATINO ORIGIN | ||||
| Not Hispanic or Latino Map | 5,847 | 23,957 | 2,729,868 | 258,267,944 |
| Hispanic or Latino Map | 147 | 3,489 | 186,050 | 50,477,594 |
| POPULATION, RACE | ||||
| White alone Map | 5,725 | 24,593 | 2,245,229 | 223,553,265 |
| Black or African American alone Map | 21 | 103 | 449,895 | 38,929,319 |
| American Indian and Alaska Native alone Map | 57 | 251 | 22,248 | 2,932,248 |
| Asian alone Map | 34 | 164 | 36,102 | 14,674,252 |
| Native Hawaiian and Other Pacific Islander alone Map | 6 | 39 | 5,863 | 540,013 |
| Some Other Race alone Map | 35 | 1,677 | 99,571 | 19,107,368 |
| Two or More Races Map | 116 | 619 | 57,010 | 9,009,073 |
| POPULATION, SEX | ||||
| Male Map | 2,932 | 13,531 | 1,431,637 | 151,781,326 |
| Female Map | 3,062 | 13,915 | 1,484,281 | 156,964,212 |
| POPULATION, AGE (18 YEARS) | ||||
| 18 years and over Map | 5,248 | 21,263 | 2,204,443 | 234,564,071 |
| Under 18 years | 746 | 6,183 | 711,475 | 74,181,467 |
| POPULATION, AGE | ||||
| Under 5 years | 185 | 1,606 | 197,689 | 20,201,362 |
| 5 to 9 years | 208 | 1,734 | 196,877 | 20,348,657 |
| 10 to 14 years | 229 | 1,822 | 197,559 | 20,677,194 |
| 15 to 17 years | 124 | 1,021 | 119,350 | 12,954,254 |
| 18 and 19 years | 82 | 577 | 84,455 | 9,086,089 |
| 20 years | 35 | 254 | 42,770 | 4,519,129 |
| 21 years | 33 | 303 | 40,770 | 4,354,294 |
| 22 to 24 years | 91 | 824 | 116,110 | 12,712,576 |
| 25 to 29 years | 175 | 1,406 | 192,153 | 21,101,849 |
| 30 to 34 years | 186 | 1,420 | 183,739 | 19,962,099 |
| 35 to 39 years | 212 | 1,496 | 183,614 | 20,179,642 |
| 40 to 44 years | 283 | 1,627 | 182,594 | 20,890,964 |
| 45 to 49 years | 393 | 1,910 | 205,544 | 22,708,591 |
| 50 to 54 years | 539 | 2,045 | 201,722 | 22,298,125 |
| 55 to 59 years | 636 | 2,138 | 183,960 | 19,664,805 |
| 60 and 61 years | 285 | 890 | 69,489 | 7,113,727 |
| 62 to 64 years | 395 | 1,242 | 97,542 | 9,704,197 |
| 65 and 66 years | 309 | 768 | 56,719 | 5,319,902 |
| 67 to 69 years | 397 | 1,012 | 76,648 | 7,115,361 |
| 70 to 74 years | 495 | 1,251 | 101,235 | 9,278,166 |
| 75 to 79 years | 333 | 919 | 77,741 | 7,317,795 |
| 80 to 84 years | 196 | 643 | 56,236 | 5,743,327 |
| 85 years and over | 173 | 538 | 51,402 | 5,493,433 |
| MEDIAN AGE BY SEX | ||||
| Both sexes Map | 57.00 | 44.00 | 37.40 | 37.20 |
| Male Map | 57.00 | 42.40 | 36.10 | 35.80 |
| Female Map | 56.90 | 45.40 | 38.70 | 38.50 |
| HOUSEHOLDS | ||||
| Total Households Map | 2,955 | 11,393 | 1,147,084 | 116,716,292 |
| HOUSEHOLDS, HOUSEHOLD TYPE | ||||
| Family households: Map | 1,866 | 7,503 | 775,811 | 77,538,296 |
| Husband-wife family Map | 1,629 | 5,890 | 568,277 | 56,510,377 |
| Other family: Map | 237 | 1,613 | 207,534 | 21,027,919 |
| Male householder, no wife present Map | 74 | 523 | 54,211 | 5,777,570 |
| Female householder, no husband present Map | 163 | 1,090 | 153,323 | 15,250,349 |
| Nonfamily households: Map | 1,089 | 3,890 | 371,273 | 39,177,996 |
| Householder living alone Map | 893 | 3,212 | 310,792 | 31,204,909 |
| Householder not living alone Map | 196 | 678 | 60,481 | 7,973,087 |
| HOUSEHOLDS, HISPANIC OR LATINO ORIGIN OF HOUSEHOLDER | ||||
| Not Hispanic or Latino householder: Map | 2,915 | 10,551 | 1,101,427 | 103,254,926 |
| Hispanic or Latino householder: Map | 40 | 842 | 45,657 | 13,461,366 |
| HOUSEHOLDS, RACE OF HOUSEHOLDER | ||||
| Householder who is White alone | 2,855 | 10,585 | 918,812 | 89,754,352 |
| Householder who is Black or African American alone | 6 | 29 | 167,878 | 14,129,983 |
| Householder who is American Indian and Alaska Native alone | 24 | 91 | 8,070 | 939,707 |
| Householder who is Asian alone | 12 | 46 | 11,287 | 4,632,164 |
| Householder who is Native Hawaiian and Other Pacific Islander alone | 2 | 10 | 1,180 | 143,932 |
| Householder who is Some Other Race alone | 9 | 406 | 24,566 | 4,916,427 |
| Householder who is Two or More Races | 47 | 226 | 15,291 | 2,199,727 |
| HOUSEHOLDS, HOUSEHOLD TYPE BY HOUSEHOLD SIZE | ||||
| Family households: Map | 1,866 | 7,503 | 775,811 | 77,538,296 |
| 2-person household Map | 1,338 | 3,896 | 352,616 | 31,882,616 |
| 3-person household Map | 277 | 1,462 | 179,263 | 17,765,829 |
| 4-person household Map | 150 | 1,146 | 140,067 | 15,214,075 |
| 5-person household Map | 61 | 567 | 64,607 | 7,411,997 |
| 6-person household Map | 24 | 254 | 24,293 | 3,026,278 |
| 7-or-more-person household Map | 16 | 178 | 14,965 | 2,237,501 |
| Nonfamily households: Map | 1,089 | 3,890 | 371,273 | 39,177,996 |
| 1-person household Map | 893 | 3,212 | 310,792 | 31,204,909 |
| 2-person household Map | 183 | 592 | 49,495 | 6,360,012 |
| 3-person household Map | 11 | 60 | 7,187 | 992,156 |
| 4-person household Map | 2 | 22 | 2,752 | 411,171 |
| 5-person household Map | 0 | 1 | 704 | 126,634 |
| 6-person household Map | 0 | 2 | 203 | 48,421 |
| 7-or-more-person household Map | 0 | 1 | 140 | 34,693 |
| HOUSING UNITS | ||||
| Total Housing Units Map | 3,876 | 13,559 | 1,316,299 | 131,704,730 |
| HOUSING UNITS, OCCUPANCY STATUS | ||||
| Occupied Map | 2,955 | 11,393 | 1,147,084 | 116,716,292 |
| Vacant Map | 921 | 2,166 | 169,215 | 14,988,438 |
| HOUSING UNITS, OCCUPIED, TENURE | ||||
| Owned with a mortgage or a loan Map | 1,328 | 4,656 | 469,654 | 52,979,430 |
| Owned free and clear Map | 1,012 | 3,468 | 298,502 | 23,006,644 |
| Renter occupied Map | 615 | 3,269 | 378,928 | 40,730,218 |
| HOUSING UNITS, VACANT, VACANCY STATUS | ||||
| For rent Map | 130 | 405 | 46,443 | 4,137,567 |
| Rented, not occupied Map | 2 | 14 | 2,139 | 206,825 |
| For sale only Map | 111 | 273 | 18,500 | 1,896,796 |
| Sold, not occupied Map | 32 | 77 | 4,995 | 421,032 |
| For seasonal, recreational, or occasional use Map | 554 | 855 | 38,153 | 4,649,298 |
| For migrant workers Map | 0 | 0 | 345 | 24,161 |
| Other vacant Map | 92 | 542 | 58,640 | 3,652,759 |
| HOUSING UNITS, OCCUPIED, AVERAGE HOUSEHOLD SIZE BY TENURE | ||||
| Total: Map | 2.02 | 2.39 | 2.47 | 2.58 |
| Owner occupied Map | 2.05 | 2.38 | 2.51 | 2.65 |
| Renter occupied Map | 1.93 | 2.41 | 2.40 | 2.44 |
| HOUSING UNITS, OCCUPIED, TENURE BY RACE OF HOUSEHOLDER | ||||
| Owner occupied: Map | 2,340 | 8,124 | 768,156 | 75,986,074 |
| Householder who is White alone Map | 2,265 | 7,631 | 660,988 | 63,446,275 |
| Householder who is Black or African American alone Map | 4 | 18 | 76,542 | 6,261,464 |
| Householder who is American Indian and Alaska Native alone Map | 18 | 56 | 4,697 | 509,588 |
| Householder who is Asian alone Map | 10 | 32 | 6,034 | 2,688,861 |
| Householder who is Native Hawaiian and Other Pacific Islander alone Map | 0 | 3 | 217 | 61,911 |
| Householder who is Some Other Race alone Map | 6 | 243 | 11,471 | 1,975,817 |
| Householder who is Two or More Races Map | 37 | 141 | 8,207 | 1,042,158 |
| Renter occupied: Map | 615 | 3,269 | 378,928 | 40,730,218 |
| Householder who is White alone Map | 590 | 2,954 | 257,824 | 26,308,077 |
| Householder who is Black or African American alone Map | 2 | 11 | 91,336 | 7,868,519 |
| Householder who is American Indian and Alaska Native alone Map | 6 | 35 | 3,373 | 430,119 |
| Householder who is Asian alone Map | 2 | 14 | 5,253 | 1,943,303 |
| Householder who is Native Hawaiian and Other Pacific Islander alone Map | 2 | 7 | 963 | 82,021 |
| Householder who is Some Other Race alone Map | 3 | 163 | 13,095 | 2,940,610 |
| Householder who is Two or More Races Map | 10 | 85 | 7,084 | 1,157,569 |
| HOUSING UNITS, OCCUPIED, TENURE BY HISPANIC OR LATINO ORIGIN OF HOUSEHOLDER | ||||
| Owner occupied: Map | 2,340 | 8,124 | 768,156 | 75,986,074 |
| Not Hispanic or Latino householder Map | 2,310 | 7,658 | 746,179 | 69,617,625 |
| Hispanic or Latino householder Map | 30 | 466 | 21,977 | 6,368,449 |
| Renter occupied: Map | 615 | 3,269 | 378,928 | 40,730,218 |
| Not Hispanic or Latino householder Map | 605 | 2,893 | 355,248 | 33,637,301 |
| Hispanic or Latino householder Map | 10 | 376 | 23,680 | 7,092,917 |
| HOUSING UNITS, OCCUPIED, TENURE BY HOUSEHOLD SIZE | ||||
| Owner occupied: Map | 2,340 | 8,124 | 768,156 | 75,986,074 |
| 1-person household Map | 588 | 1,961 | 173,250 | 16,453,569 |
| 2-person household Map | 1,348 | 3,670 | 303,172 | 27,618,605 |
| 3-person household Map | 225 | 1,053 | 125,565 | 12,517,563 |
| 4-person household Map | 105 | 789 | 98,808 | 10,998,793 |
| 5-person household Map | 47 | 380 | 42,758 | 5,057,765 |
| 6-person household Map | 18 | 160 | 15,422 | 1,965,796 |
| 7-or-more-person household Map | 9 | 111 | 9,181 | 1,373,983 |
| Renter occupied: Map | 615 | 3,269 | 378,928 | 40,730,218 |
| 1-person household Map | 305 | 1,251 | 137,542 | 14,751,340 |
| 2-person household Map | 173 | 818 | 98,939 | 10,624,023 |
| 3-person household Map | 63 | 469 | 60,885 | 6,240,422 |
| 4-person household Map | 47 | 379 | 44,011 | 4,626,453 |
| 5-person household Map | 14 | 188 | 22,553 | 2,480,866 |
| 6-person household Map | 6 | 96 | 9,074 | 1,108,903 |
| 7-or-more-person household Map | 7 | 68 | 5,924 | 898,211 |
Loading...